When you have an event log in MXML format, you can load it into ProM and inspect it in more detail. To open the log file, press the left-most button in the ProM toolbar, choose the file from the right location, and leave the import type as MXML Log reader. A log window will be opened in ProM, which allows to inspect and filter the log as shown below.
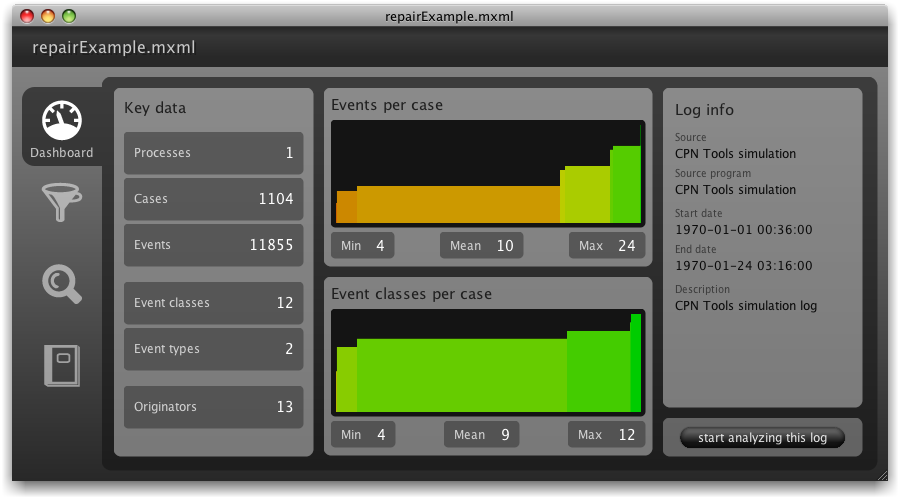
The first view that is displayed for any log is the Dashboard view as depicted in Figure 1. On one glance, it tells the total number of processes, cases and events that are contained in the log. Furthermore, the number of event classes, that is, different kind of log events, and event types, such as 'start' and 'complete', and originators are shown (see “Key data” in Figure 1).
In the middle a graphical representation of the total number of events per case, and of the number of different events per case is shown. The cases are simply sorted along the x-axis based on their amount of events, or their amount of different events, respectively. This can give very useful profile information about the diversity of the log! For example, it is easy to spot if there are many short and only a few very long process instances.
Finally, to the “Log info” section contains meta information and the spanned time frame of the log. The button below directly brings up the action trigger, which enables mining or further analysis of the log.
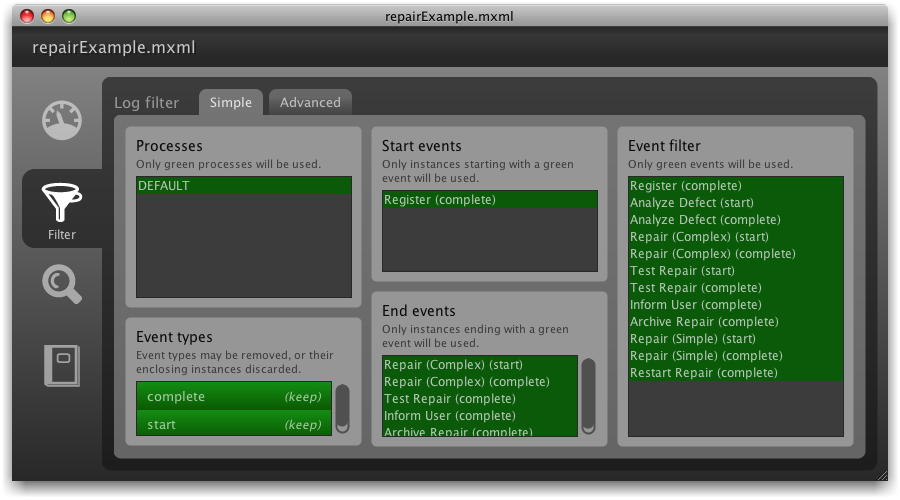
Log filters are a way to exclude events from, or otherwise manipulate, an event log. The simple log filter provides a quick interface for the most common tasks (see Figure 2).
In the “Event filter” category unwanted events can be directly toggled to be discarded from the log.
The “Start events” and “End events” sections display those events that have been observed directly at the beginning or at the end of a process instance, respectively. Deselecting certain, for example, end events leads to ignoring those process instances that end with them. This can be very useful to clean the log from cases that are not finished yet. For instance, in Figure 2 one can see that not all cases end with the event “Archive Repair” (which is supposed to be the last activity in this process), and we can exclude them by simply deselecting the end events “Repair (Complex)” etc. up to “Inform User”.
Finally, the “Event types” section allows to either keep or remove certain types of events, or to discard the whole instance containing a certain type of event (which is useful for cleaning the log from process instances that contain, e.g., error types like 'abort' events).
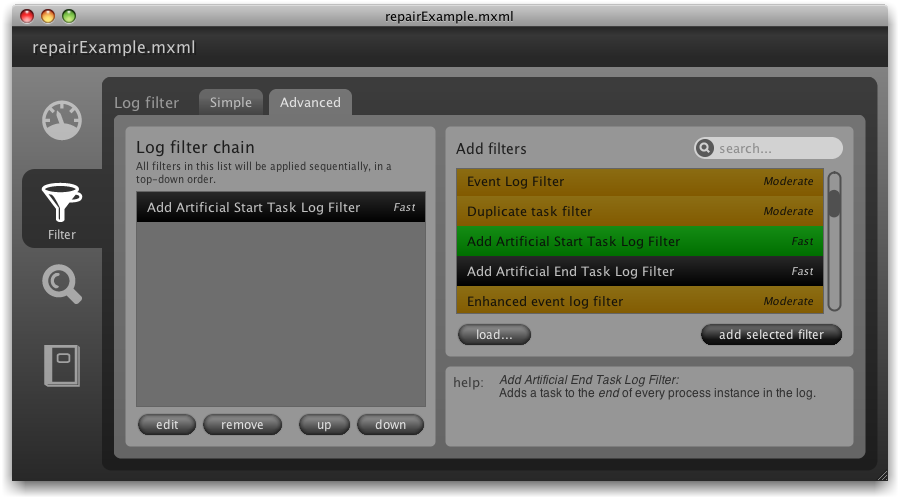
The advanced log filter view enables more complex log transformation tasks, such as adding events, renaming them according to regular expression patterns, or remove repetitions of the same kind of event (see Figure 3).
In the “Add filters” section a log filter can be selected and added to the “Log filter chain” (visualized in the left half of the window). For example, in Figure 3 the filter “Add artificial start task” is already on the stack, and the filter “Add artificial end task” is about to be added on top of that. Each filter comes with a small help text and may have additional options that appear as soon as the 'add selected filter' button is pressed. Their complexity is roughly indicated by either 'fast', 'moderate', or 'slow'.
Note that log filters can be searched for efficiently by their name (see search field in top right corner). Furthermore, a chain of log filters can be modified (i.e., filters can be re-ordered, deleted etc.) and also exported for later reuse. If a previously exported filter should be imported again, simply press the button 'load…' and locate the corresponding log filter file. It will then appear in the list of available log filters.
Note: Custom log filters can be easily developed and simply show up the list next to the other filters.
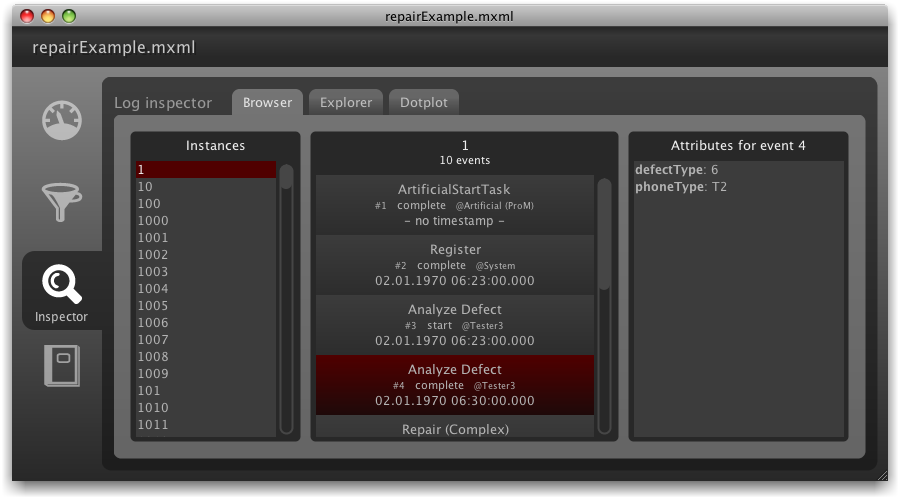
To look at the precise contents of a log, there are different views available in the log dialog. The first view is the “Browser” depicted in Figure 4. For each process instance the event sequence can be inspected in detail. Event type, originator, and time stamps show up directly in the event element while data attributes are displayed in the right-most column.
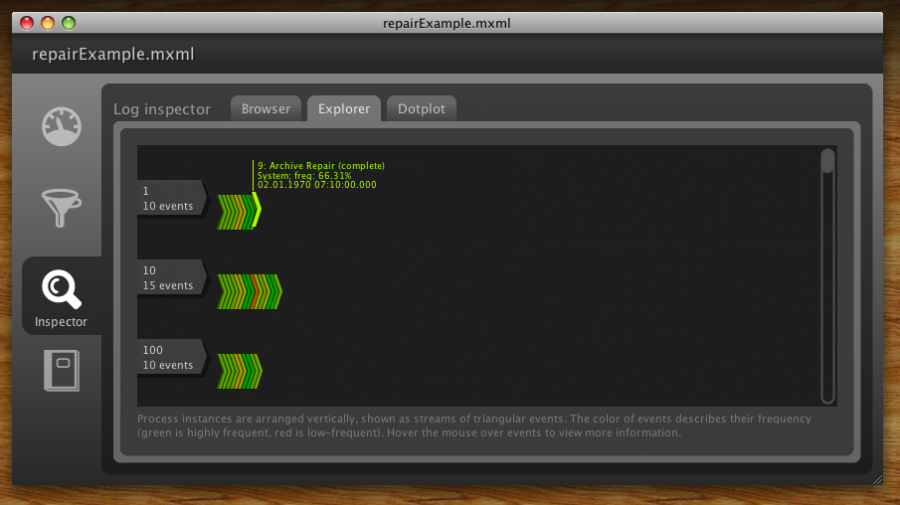
The “Explorer” provides an alternative view on the log, which is particularly useful for larger logs, is depicted in Figure 5. Process instances are layed out as horizontal event streams, and details about an event are displayed only when hovering over it. The colors resemble relative frequencies (i.e., most frequent events are colored in green, while very rare events are colored in red).
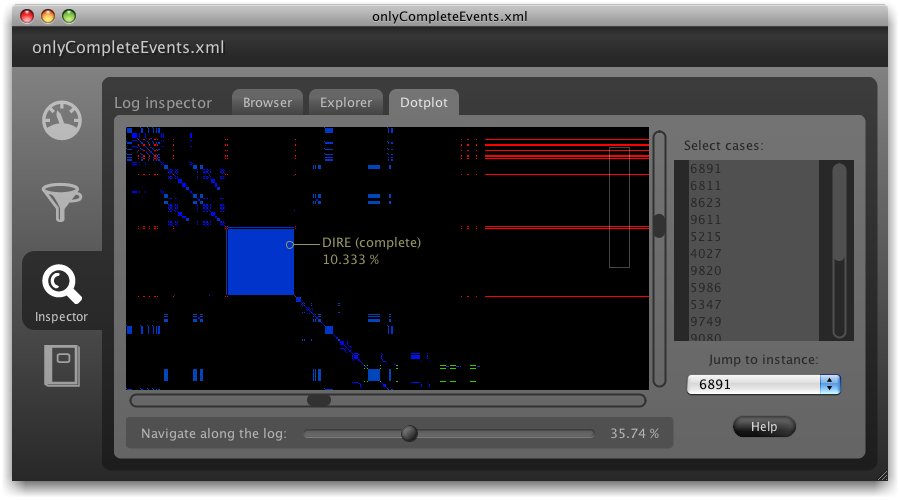
The third inspection view is called “Dotplot” (Figure 6) and directly embeds the so-called cloud chamber miner (see help page) in the log dialog. Dotplots can reveal patterns in the data for the human eye by plotting the (one-dimensional) data in a two-dimensional space. For example, repetition patterns show up as as blocks like the blue square in Figure 6. Press the 'Help' button to get a quick briefing and see also this page for further information on dotplots.
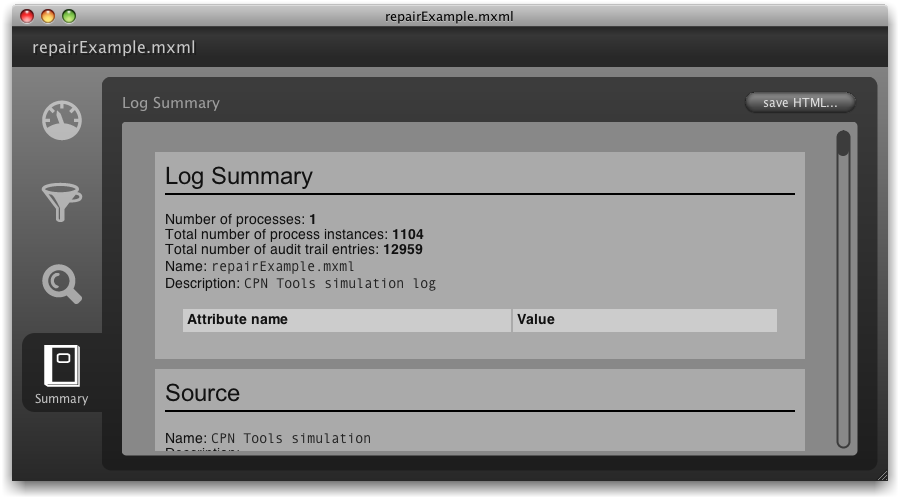
The “Log Summary” (Figure 7) provides an overview about meta data and simple frequency statistics for a log, such as the number of process instances, log events and originator actions. It can be exported as an HTML document (see upper right corner).