This plug-in calculates basic statistics about activity execution times, and data attribute values. To calculate activity times, it is important that your log contains both start and complete events (the time between is one activity duration).
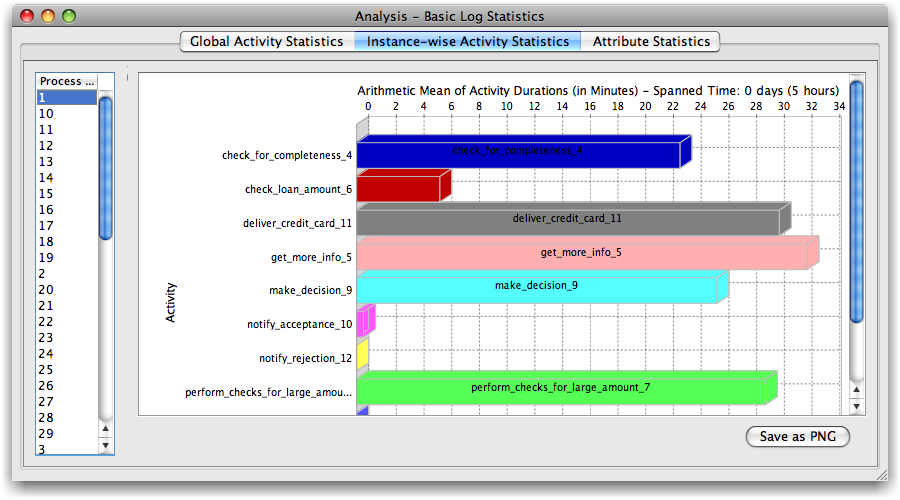
The results can be displayed either in a graphical way (see Figure 1), which can be exported as a PNG file, or as a textual overview (see Figure 2), which can be exported as an HTML or CSV file.
In the graphical view, you can determine according to which column the results should be sorted.

You can view the results for the whole log (Global Activity Statistics) as well for each individual process instance (Instance-wise Activity Statitistics). Note that the settings adjusted in the global view also apply to the instance-based view. Furthermore, you need to press the button “Apply Changes” to actually change the presentation after modifying the settings.
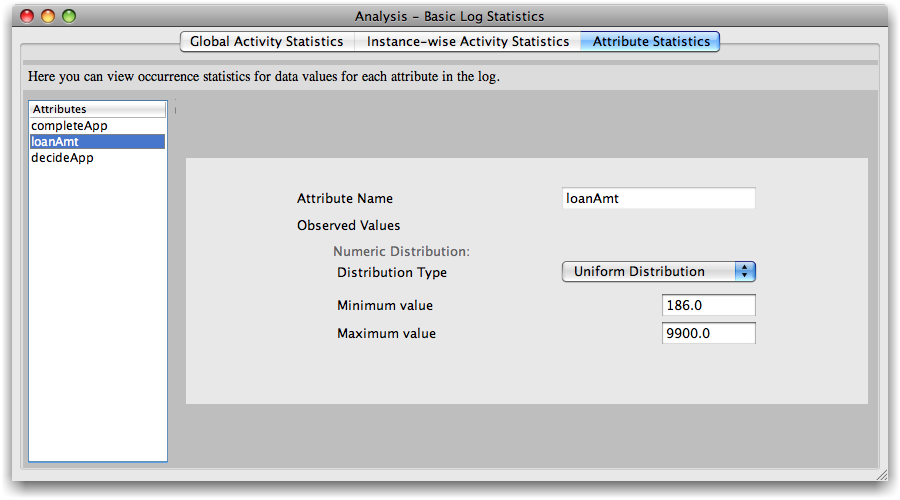
Finally, also the values of data attributes are evaluated, and simple measures such frequencies of nominal values, or minimum and maximum numeric values are calculated. This can be directly useful for generating simulation models that include data. See also Simulation model overview page .
LimitationsIf duplicate tasks are being executed in parallel, it naturally cannot be distinguished which of the duplicates the start and complete belongs to. So, in this case the results might not be accurate.